Results

Figure 2
|

Figure 3
|
These figures represent the average number of BWA days on the left (Figure 2), and the total number of BWA on the right (Figure 3) in each region with the government in power filling the bars.
The median total number of BWAs and the average number of effect days for the liberal party is 184 and 107 respectfully. The median total number of BWAs and the average number of effect days for the conservative are 94 and 148 respectfully.
The median total number of BWAs and the average number of effect days for the liberal party is 184 and 107 respectfully. The median total number of BWAs and the average number of effect days for the conservative are 94 and 148 respectfully.

Figure 4: The Log number of effect days for the long term boil water advisories only. Long term is defined by the Canadian government as any advisory that lasts longer than 365 days. The median number of effect days for the long term BWAs are 883.5 and the median number of long term BWAs is 224.
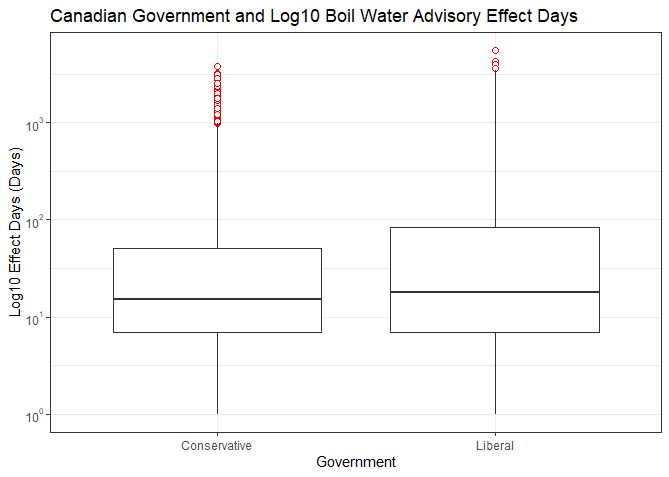
Figure 6: The log number of effect days of each governing party between 1997 and 2017.
|

Figure 5: The population frequency of boil water advisories for our study period is further separated by the respective Canadian regions. A trendline was added to show the 20 year trend in the number of BWAs. The government in power is represented by the red (liberal) and blue (conservative) bars on the x-axis. The median number of BWA is 124.5 and the median number of effect days is 121.5. We use median values because of the skewness of the data. We removed 2017 for this figure because we did not have all the data for that year and it would have wrongly affected the trendline.
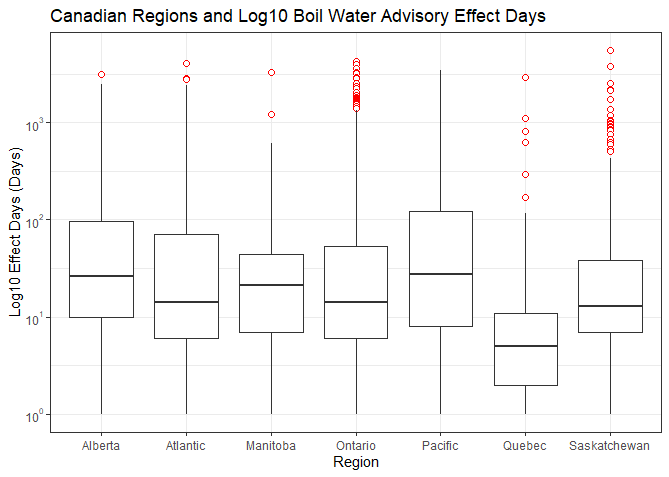
Figure 7: The log number of effect days of each region between 1997 and 2017.
|
Both these figures (figures 6 & 7) are on modified log10 scales and the outliers are indicted by the red circles. These points are not true outliers as they are real boil water advisories that were recorded.

Figure 8: Pivot table representing the total count and average number of effect days for each province and the governing parties.
Discussion
Figures 2 and 3 show the importance of the government looking at both the total number of BWAs and the average amount of days each BWA lasts when triaging which communities should be focused on first. For example when looking at the Atlantic and Pacific regions' total amount of BWAs, they appear to have less than other regions. However if you look at the average number of days each of those BWAs were in effect, they are much higher than other regions. This suggests that the federal government should consider allocating more resources to these regions rather than regions with more BWAs of shorter durations. It also suggests that there are certain provinces that need more attention than others. This is further explored in figure 8 where in every region, there are more BWAs during conservative federal leadership than liberal. The average number of effect days vary between regions however. This should be further investigated.
Our analysis revealed that over the last 20 years the Liberal party had a median of 90 more BWA when in power than the conservative party, however the number of days the BWA was in effect had a median of 41 more days when the conservative party was in power. We believe that the extra number of BWAs during the liberal government could be due to increased reporting efforts since more attention was brought to the issue when the Liberal government made their promise back in 2017. The greater number of effect days during the conservative government should be investigated further to understand this disparity as we cannot directly correlate conservative leadership with more longer BWAs.
Long term BWAs also tell a different story and are represented by figure 4 and 5. When we select the BWAs that have lasted longer than 1 year, the median number of effect days is 883.5 and a mean of 1209. We chose to use the median values in our analyses because of the data skewness towards the longer BWAs. When we look at just short term BWAs we find that the median number of effect days is 13 and the mean is 38. This tells us that most BWAs under 1 year have a short BWA period of 13 days. Where all BWAs more than a year seem to be left for much longer reaching 883.5 BWA effect days. When we compare the number of BWAs there are 723 recorded under short term and 224 recorded under long term. It is possible that some of the short term BWA are issued either as a safety measure but the issue was easy to fix, or they may be reporting them as they were being resolved. More information regarding the specifics of these BWAs needs to be found to find an possible cause of this difference. This information would be available from the affected Indigenous Communities. Understanding the great magnitude of difference between short and long term BWAs and addressing them should be the main focus of the Liberal governments effort. Waldner et al. suggest that the next steps for improving water conditions in Indigenous communities needs to involve the communities in the process to better understand each community’s specific water struggles, and health concerns (2017). This partnership with communities would allow for improvements that have not been possible with past infrastructure, and monitoring investments alone. As our findings show, there are vast differences in length of advisories experienced by different communities, and these differences would also be better addressed with a community partnership-based approach which would tailor solutions to each community’s specific needs.
In figure 5 the 20 year trendline increases up until 2011 and we believe that this is likely because the BWA issue was not investigated in the past so already existing BWAs were not reported until recently. According to the Human Rights Watch many Indigenous Communities report that water quality was a large issue years before the government reported it (2016). After 2011 BWAs trend downward which tells us that government intervention may be successfully reducing the number of BWAs in Canada. The liberal government has stated that they were involved in lifting 97 long term drinking water advisories since November 2015 (Government of Canada, 2020). Actions they say they have taken include: studies, new system design work, repairs on existing systems, construction of new infrastructure, and improved training and monitoring.
The population median says there are 124.5 advisories per year and each advisory on average lasts 121.5 days which is a significant amount of time without clean drinking water in many communities across the country each year. It is important to note that these median values represent both short and long term data.
As previously mentioned, on World Water Day in 2017, the Liberal leader Justin Trudeau announced his commitment to ending all BWAs, specifically long term BWAs by March of 2021 however earlier this year in 2020 he backed out of this promise (Thompson, 2020). The implications this has for the Indigenous communities that still remain under BWAs is unknown and it is unclear when the remaining communities BWAs will be resolved.
Our analysis would be more complete had the Government of Canada released the data between 2017 and 2020. We will have a better understanding of how much of an impact the liberal government had over the past 3 years, how far we still need to go, and the consequences of backing out of this promise before it was complete.
Conclusion
|
Given the importance of access to clean water, the sheer number of boil water advisories over the 19 years this data spans is unacceptable. When deciding where to first allocate funds to fix this issue, length of advisories should be considered in addition to number of advisories as some regions with few advisories have the most long term ones. Long term advisories mean the community is experiencing water related health consequences and the financial burden of purchasing clean water for a longer period of time, are of even more urgent concern. We hope that our visualization of the data can encourage a call to action, to improve the quality of water for Indigenous communities, ending long term boil water advisories, improving the health, and wellbeing of those impacted.
|

Image retrieved from: https://www.globalcitizen.org/en/content/canada-indigenous-drinking-water-dangers/
|
Thank you for vising our website :)

Image retrieved from: https://news2-images.vice.com/uploads/2017/08/ViceBoilAdvisoryIllustration-e1503409244499.jpg?crop=1xw:0.75xh;center,center
References
Assembly of First Nations Environmental Stewardship Unit. (2008). Climate change and Water: Impacts and Adaptations for First Nations Communities. Retrieved from https://www.afn.ca/uploads/files/env/08-03-27_climate_change_and_water_research_paper_final.pdf
Becklumb, P. (2013).Federal and Provincial Jurisdiction to Regulate Environmental Issues. Ottawa, ON: Parliamentary Information and Research Service, Government of Canada.
First Nations Health Authority. (2020, December 9). Drinking Water Advisories. Retrieved from https://www.fnha.ca/what-we-do/environmental-health/drinking-water-advisories
Government of Canada. (2020, February, 17). Ending long-term drinking water advisories. Retrieved from https://www.sac-isc.gc.ca/eng/1506514143353/1533317130660
Health Canada. (2016, January 1). Drinking Water Advisories in First Nations Communities. Retrieved from https://open.canada.ca/data/en/dataset/5f73fff7-2011-48b9-af52-ffb31e68539c?wbdisable=true
Human Rights Watch. (2020). Make it Safe: Canada’s Obligation to End the First Nations Water Crisis Retrieved from https://www.hrw.org/report/2016/06/07/make-it-safe/canadas-obligation-end-first-nations-water-crisis
Page, E., and Ian, D. (2019). There's Something in the Water. 2 Weeks Notice.
Parliament of Canada. (1867). Constitution Act. Retrieved from http://laws-lois.justice.gc.ca/eng/ const/
Reading, J., Perron, D., Marsden, N., Edgar, R., Saravana-Bawan, B., and Baba, L. (2011). Crisis on Tap: Seeking Solutions for Safe Water for Indigenous Peoples. Victoria, BC: Centre for Aboriginal Health Research, University of Victoria.
Staff. (2019, October 5). NDP’s Singh promises $1.8B to provide clean drinking water in Indigenous communities. The Canadian Press. Retrieved from https://globalnews.ca/news/5994764/jagmeet-singh-grassy-narrows/
The Canada Guide. (2020). Prime Minsters of Canada. Retrieved from https://thecanadaguide.com/history/prime-ministers/
Thompson, E. E., Post, Y. L., and McBean, E. A. (2017). A decade of drinking water advisories: Historical evidence of frequency, duration and causes. Canadian Water Resources Journal, 42(4), pp. 378-390. https://doi.org/10.1080/07011784.2017.1387609
Thompson, N. (2020, October 23).Trudeau Walks Back Pledge to End Boil-Water Advisories on First Nations by 2021. The Canadian Press. Retrieved from https://www.chrisd.ca/2020/10/23/first-nations- boil-water-advisories-canada
Trudeau, J. Prime Minister Speech to the Assembly of First Nations Special Chiefs Assembly on December 6, 2016 in Gatineau, Quebec. Retrieved from https://pm.gc.ca/en/news/speeches/2016/12/06/prime-minister-justin-trudeaus-speech-assembly-first-nations-special
Waldner, C. L., Aimezelli, H. T., McLeod, L., Zagozewski, R., Bradford, L. E. A., and Bharadwaj, L. A. (2017). Self-reported Effects of Water on Health in First Nations Communities in Saskatchewan, Canada: Results From Community-Based Participatory Research. Environmental Health Insights, pp. 1-13. DOI: 10.1177/1178630217690193
White, J.P., Murphy, L., and Spence, N. (2012). Water and Indigenous peoples: Canada’s paradox. International Indigenous Policy. Retrieved from http://ir.lib.uwo.ca/iipj/vol3/iss3/3
